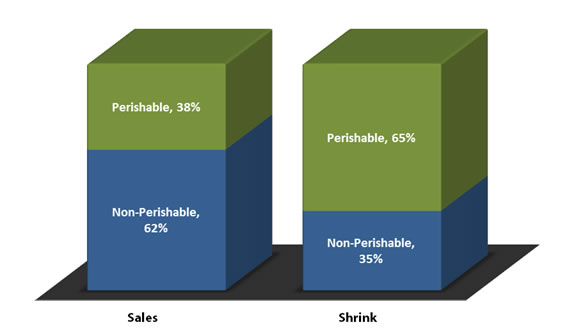
Sales and Shrink by Department
Perishable vs. Non-Perishable

Survey respondents reported overall store shrink at 2.70% of retail sales, with a low average of 1.76% of retail sales and a high average of 3.10% of retail sales.
65% of all store shrink and 38% of total-store sales were attributed to perishable departments. The meat department contributed the highest amount of total store shrink at 18% of total store shrink or $93,414 in annual in profit loss. Produce was the second-highest shrink contributing department at 16% of total store shrink or $82,022 in profit loss. Deli department contributed the third highest amount of total store shrink (tied with Grocery department) at 14% of total store shrink or $74,048 of profit loss.
Non-perishable departments (grocery and center store) averaged 62% of the total store sales and contributed 35% of total store shrink. According to survey respondents, the average grocery department reported 1.10% shrink, or $71,010 in annual in profit loss. General Merchandise shrink posted the second-highest non-perishable shrink at 2.71% shrink, or $41,011 in profit loss.
Sales and Shrink by Department
A close look at individual departments reveals significant profit improvement opportunities for companies adopting noted best practices within a culture of store operations and loss prevention collaboration. The following table provides details for sales and shrink by department.
DEPARTMENT |
SHRINK CONTRIBUTION |
SHRINK |
DEPARTMENT SHRINK |
PERCENTAGE OF SALES |
AVERAGE ANNUAL SALES |
Meat |
18% | $93,414 | 4.1% | 12% | $2,278,390 |
Produce |
16% | $82,022 | 4.8% | 9% | $1,708,792 |
Deli |
14% | $74,048 | 7.8% | 5% | $949,329 |
Bakery |
6% | $30,379 | 8.0% | 2% | $379,732 |
Seafood |
5% | $23,543 | 6.2% | 2% | $379,732 |
Dairy |
4% | $19,936 | 1.5% | 7% | $1,329,061 |
Floral |
2% | $9,683 | 5.1% | 1% | $189,866 |
PERISHABLES |
4.62% |
65% |
$333,025 |
38% |
$7,214,901 |
Grocery |
14% | $71,010 | 1.1% | 34% | $6,455,438 |
GM |
8% | $41,011 | 2.7% | 8% | $1,518,926 |
RX |
5% | $25,062 | 2.2% | 6% | $1,139,195 |
HBA |
3% | $14,240 | 2.5% | 3% | $569,597 |
Frozen |
2% | $7,595 | 0.8% | 5% | $949,329 |
Beer/Wine/Liquor |
2% | $9,493 | 1.0% | 5% | $949,329 |
Video |
1% | $3,892 | 4.1% | 1% | $94,933 |
NON-PERISHABLES |
1.48% |
35% |
$172,303 |
62% |
$11,676,747 |
|---|---|---|---|---|---|
TOTAL |
100% |
$512,922 |
2.70% |
100% |
$18,986,581 |
For more information on best practices and shrink reduction across all departments, call 602.448.8502 or email info@wheresmyshrink.com.

